Car Life In Pie Charts (Warning - Savage.)
I made a couple the other day and people wanted more, so rather than clog up mine or any other feed, I’ve made a bunch and kept them together in one post. Enjoy…
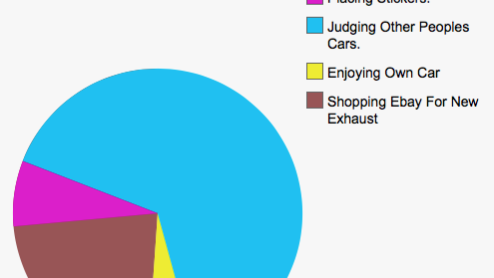
I made a couple the other day and people wanted more, so rather than clog up mine or any other feed, I’ve made a bunch and kept them together in one post. Enjoy…
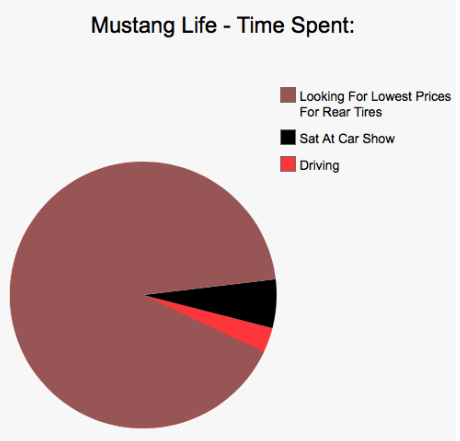
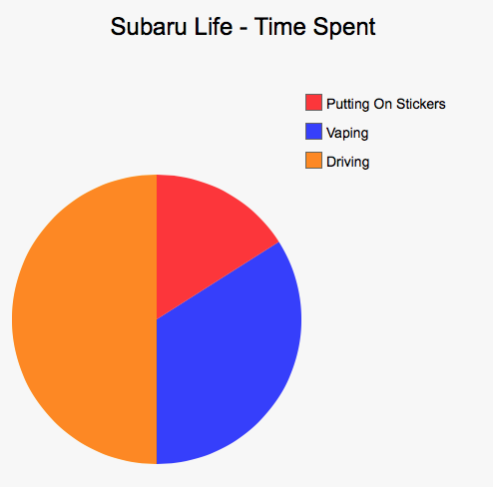
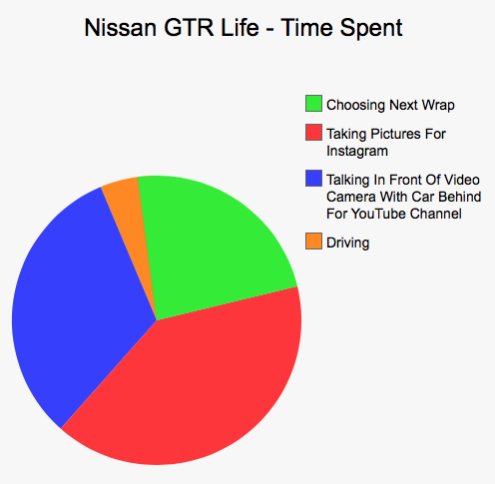
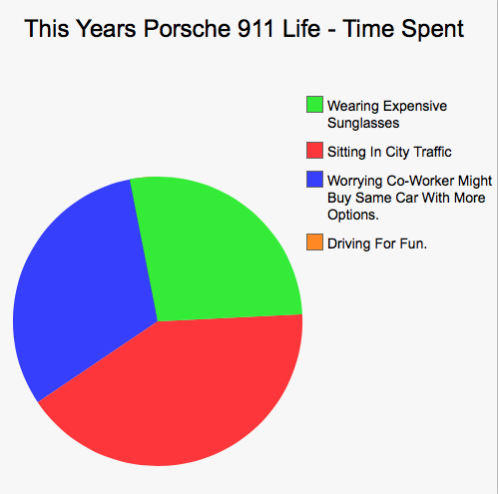
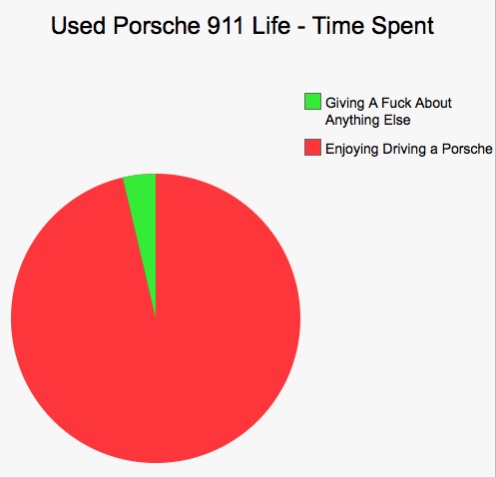
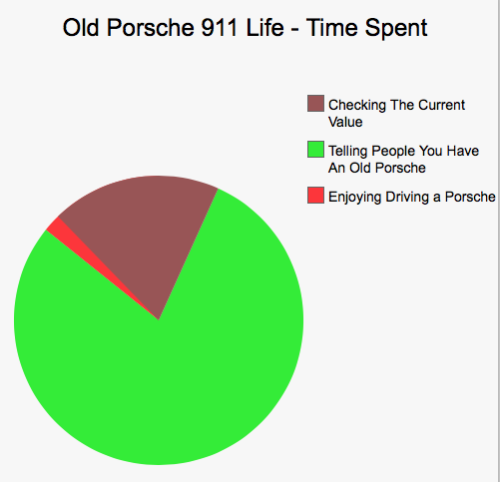
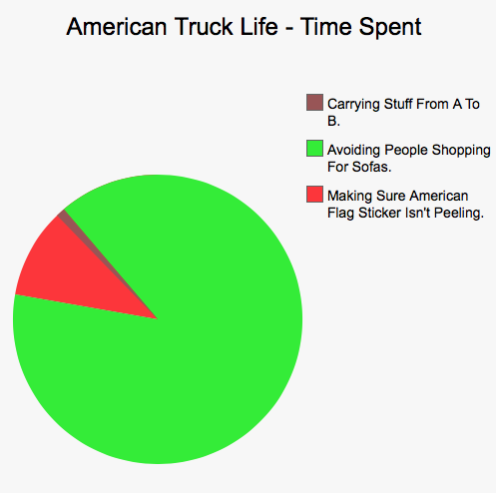
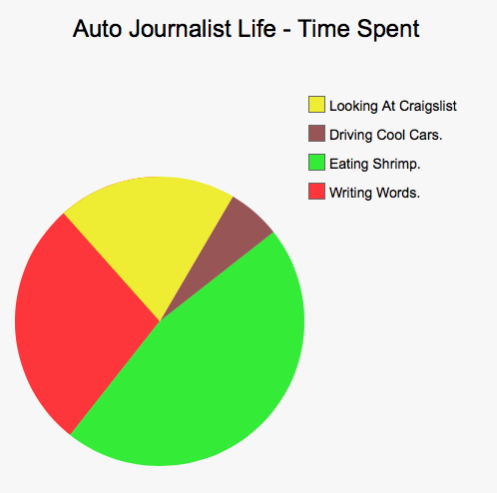
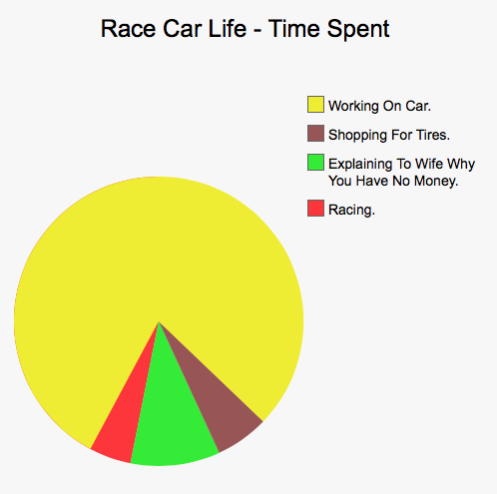
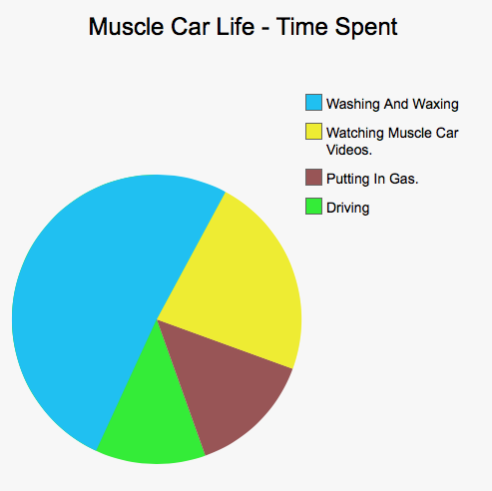
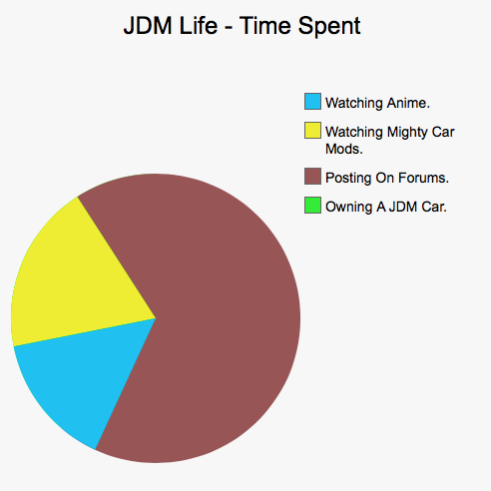
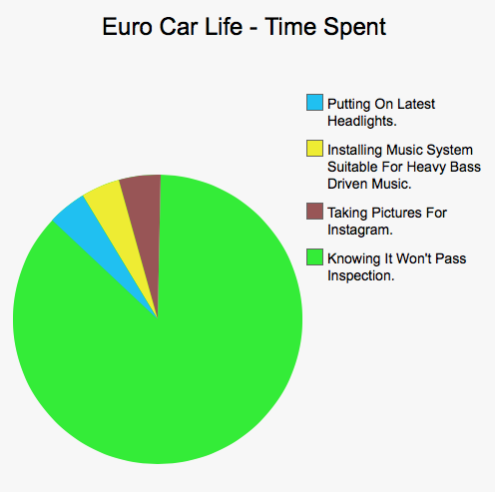
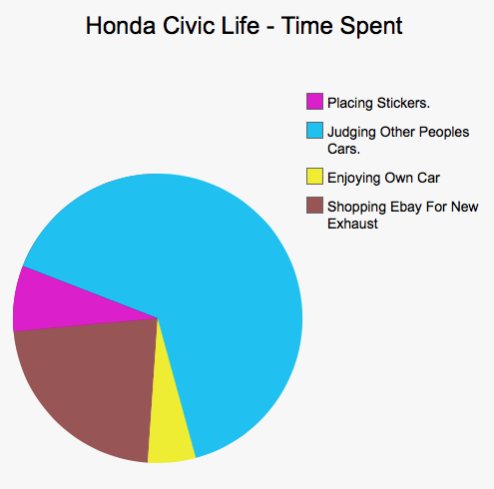
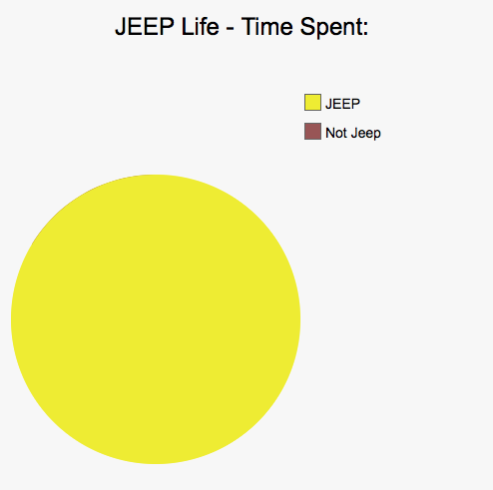
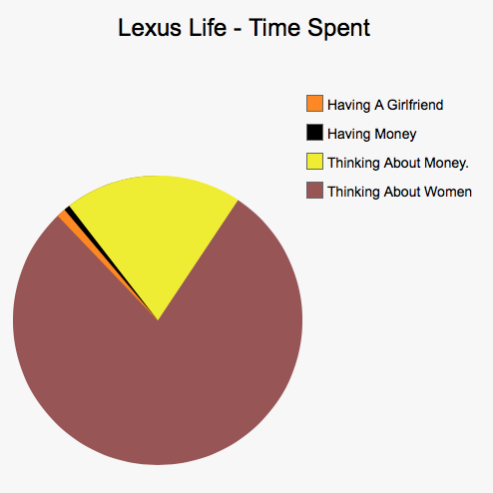
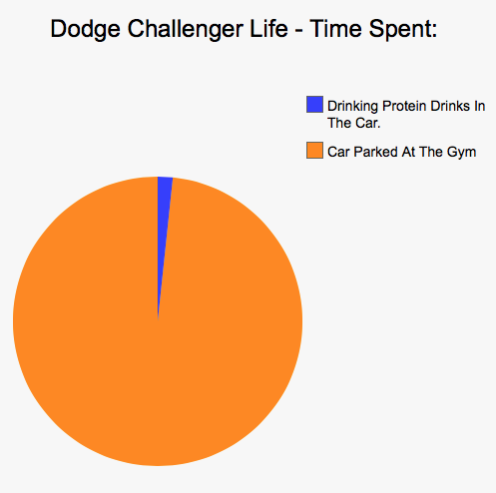
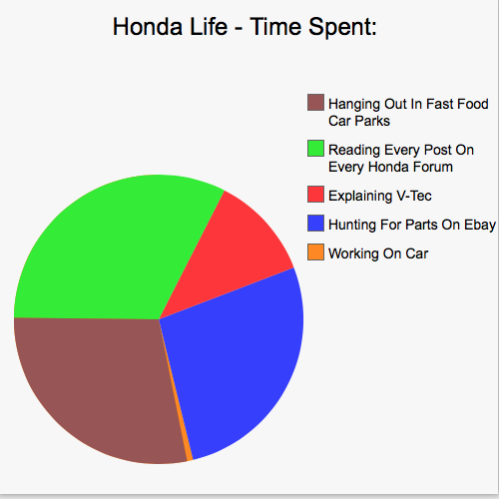
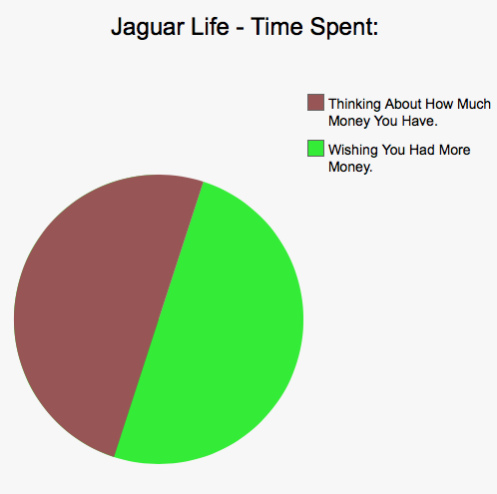
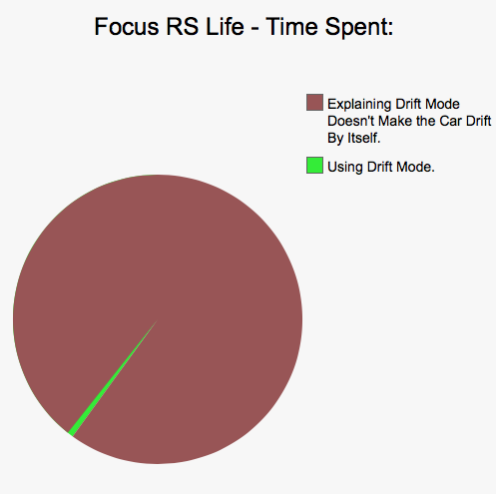
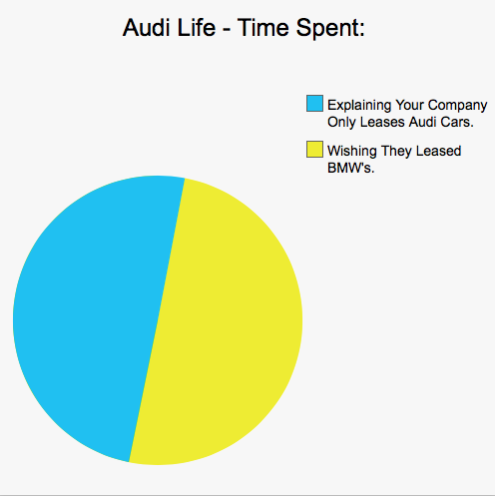
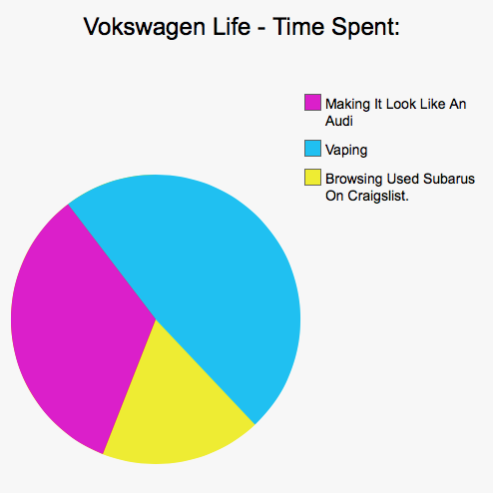
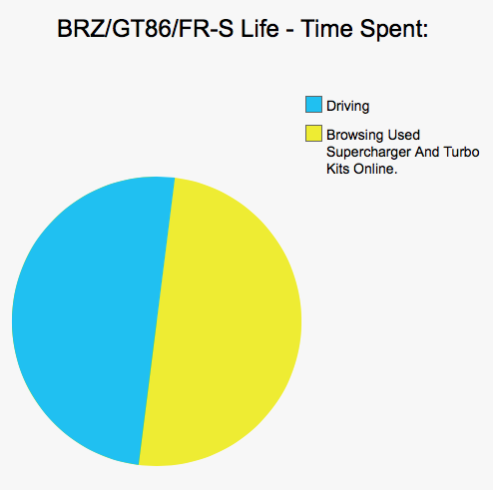
I could keep going all night… but this is what I’ve already been doing instead of my taxes.
If you have any you particularly would like to see then leave a comment and I’ll probably do another batch later on.
Comments
Hahaha this is great. Do some for enthusiast cars? Miata, E30, MR2?
Acura Integra Life: 50%Driving around thinking you look cool, 40% Driving around panicking about that odd sound, 10% looking under hood for sound, 0% Actually broken down.
You missed hitting people for the mustang chart.
Wow I felt that
Do one for dodge darts? (2.0 & 1.4T)
Holy fk 907 upvotes
I need this in a poster
Honestly it was accurate for me
SAAB 900 owner. Enjoy driving 50%, enjoy fixing 25%. oh why is this such an arse to fix 10%, people asking you why you bother owning a SAAB 15%
Pagination