A formula to objectively compare engines - N/A engines ranked!
What is the best naturally-aspirated car engine in the world? Some will look to the powerhouse V12s of Ferrari, Lamborghini and Aston Martin, or the exotic V10s of the Carrera GT and LFA. Others will look to American beasts like the LS3 or 392 Hemi.

What is the best naturally-aspirated car engine in the world? Some will look to the powerhouse V12s of Ferrari, Lamborghini and Aston Martin, or the exotic V10s of the Carrera GT and LFA. Others will look to American beasts like the LS3 or 392 Hemi. Or what about the tuner’s favourites like the 2JZ, F20C or Renesis? If only there were a way to properly compare engines without being swayed by fanboyisms and emotion.
Many of you will be familiar with the concept of horsepower per litre. It’s simply the horsepower of the engine divided by its displacement in litres. However, it unfairly favours high-revving engines because the higher an engine revs, the more air it can suck in and the more fuel it can burn.
This is where the formula comes in. It takes the engine’s horsepower, divides it by the cc of the engine and then divides it by its RPM at peak power. Note that peak power RPM is the speed of the engine when it makes the most power whereas redline is just something that the manufacturer sets to prevent the engine from destroying itself.
The result is multiplied by the Constant of Petrolheadedry which is equal to about 2,314,000. This number is calculated so that a perfectly efficient engine (assuming regular gasoline and a stoichiometric air:fuel ratio of 14.3:1) scores 100. Also note that rotary and two-stroke (not that there are any two-strokers in the list right now) have their score halved to reflect the fact that they take in one load of air per revolution (per rotor or cylinder) rather than one load per two revolutions in a 4-stroke piston engine.
So without further ado, let’s look at the list!
The Top

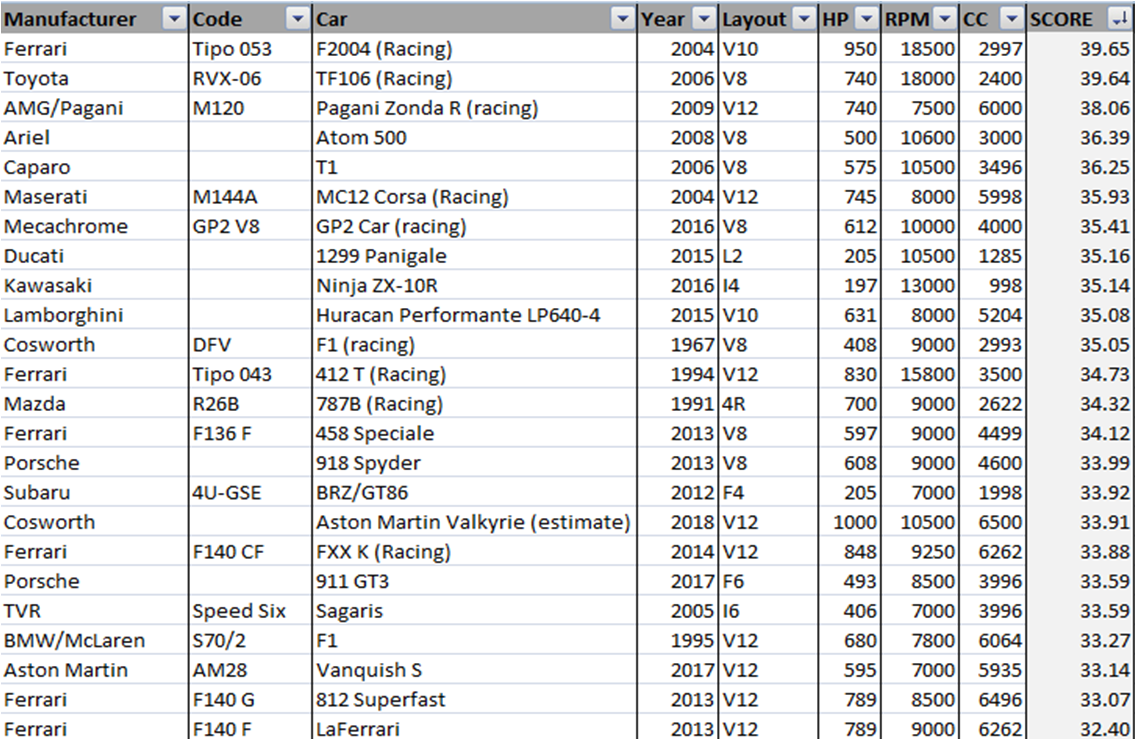
At the very top, we see F1 car engines - first the V10 from the F2004 followed by the V8 from a 2006 car. Both of these are highly-strung engines revving to nearly 20,000 RPM. F1 cars do run on slightly different fuel to regular gasoline, but the energy density and stoichiometric ratio is sufficiently similar to gasoline for it to be a valid comparison.
Next we have the Pagani Zonda R, a slightly more ordinary car with an AMG V12, but still not road-legal. This is followed by the first road-legal cars - the Ariel Atom 500 and the Caparo T1. Both of these rev to over 10,000 RPM and are absolute track monsters. We then see a few more racecars (including a GP2 engine - I would have included Alonso’s Honda F1 engine as a comparison but the formula doesn’t work for turbocharged cars) and some superbikes.
The Huracan Performante is the first vaguely normal car to appear, with its extra 30hp pushing it out in front. Then more racecars including the Mazda 4-rotor from the 787B and the Cosworth DFV engine which powered many F1 cars in the late 60s, 70s and early 80s. A good score for something so old, but I think fuel regulations back then may have been more relaxed.
We then see the first affordeable car on the list: the Toyobaru! It isn’t renowned for its engine, but it makes a good amount of power considering its modest displacement and RPM. Who would have thought that a Toyota GT86 has a better engine than a Ferrari FXX K?
The TVR Sagaris does well to be where it is, considering it was made by a relatively small, financially-insecure company and it’s over 10 years old. Also, note that the 812 Superfast beats the LaFerrari despite the extra displacement it has.
The Middle

There isn’t too much to say here so I’ll just go over the surprises:
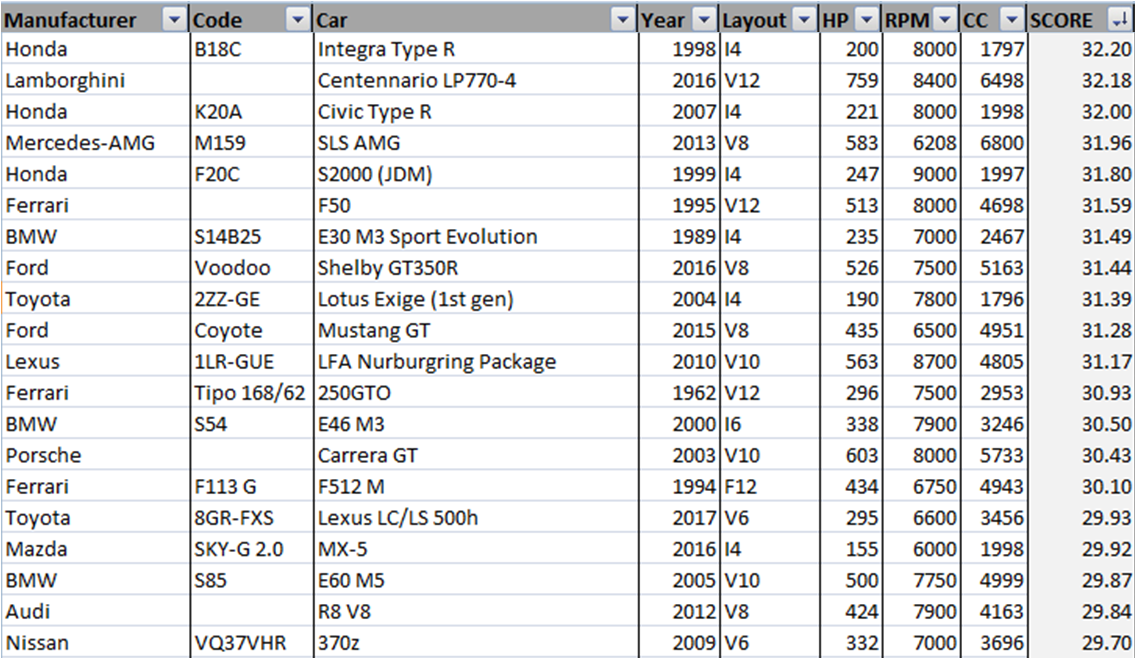
- The Ferrari F50 does surprisingly poorly considering its engine is closely derived from the F1 V12 which performs within a few points of the V10 despite being a decade older. The BMW E60 M5 is more loosely F1-derived and it too scores badly.
- Even though it’s a big, muscly V8, the AMG 6.2 engine scores well, beating smaller-displacement engines such as the Audi 4.2 V8 and Ford V8s.
- The E30 M3 beats the E46 M3. This one definitely surprised me.
- The Shelby GT350R only narrowly beats the much cheaper, cross-plane Mustang GT.
- Despite being even more exotic than the Performante, the LFA and Carrera GT don’t make it into the top section.
- The ancient 250GTO and F512 M do pretty well considering their age.
- Both Japanese V6s score relatively poorly considering they are modern engines.
The Bottom

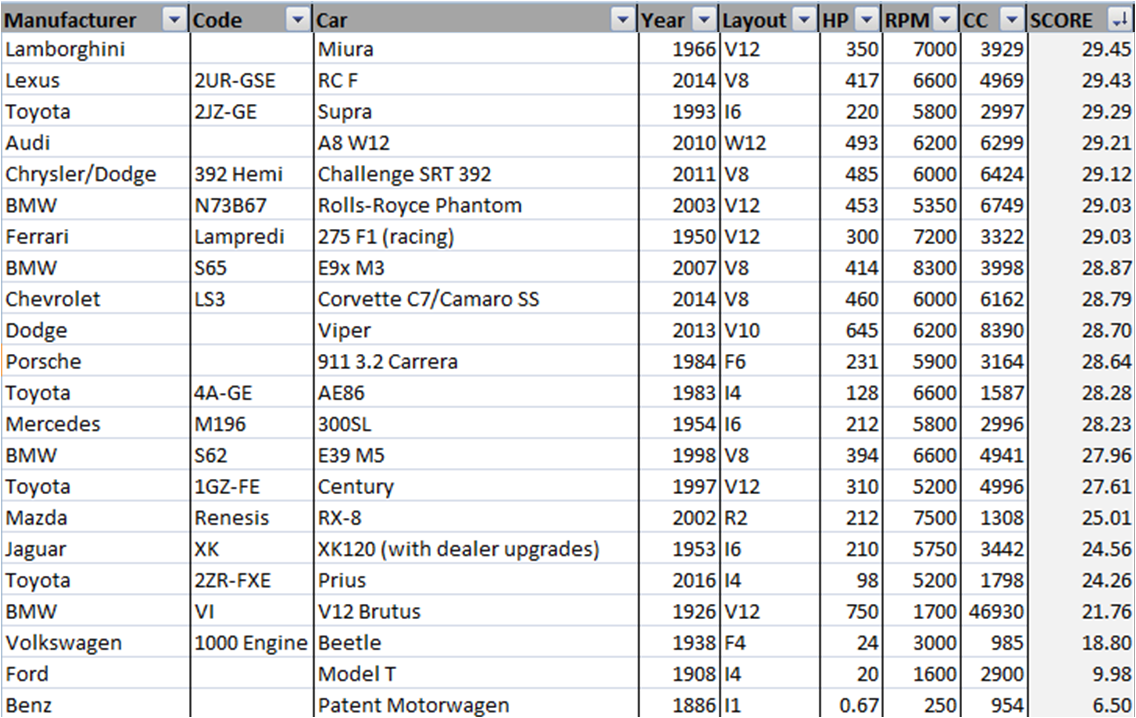
Right at the bottom, we have some of the very first cars to be built. Considering that the Motorwagen was the first car ever, a score of 6.50 is pretty respectable.Then we have the original Nazi-era Beetle and the largest engine ever used in a car, the BMW V12 aircraft engine. These scores are very good for such old cars, although the BMW can only produce that power for a maximum of one minute (normal is 500hp @1500rpm).
The Prius is an interesting case because it’s an Atkinson cycle engine so it takes in less air than a normal 1.8 by changing the valve timing. Then we have the XK120 which is probably extremely under-tuned in order to improve reliability. Remember that this was a car that averaged 100mph for for an entire week back in the early 1950s. Same probably goes for the Century, Phantom and A8 W12 which are more luxury than performance-focused.
The RX-8 does very poorly, but that’s because rotary engines are horribly inefficient. The rotary is great when weight and size are at a premium, but not when you’re trying to save fuel. They can be made to extract far more power with modifications (as in the 787B), but these basically make them racing engines and unsuitable for the road.
The BMW V8s perform surprisingly badly considering how prized these engines are. Same goes for the 2JZ.
However, one of the biggest disappointments was the 1950 Ferrari F1 V12. It scores about 7% worse than the 250GTO which is road-legal and only a decade or so younger.
What’s next?
If there are any engines you really wanted to see on here that I missed, comment them and I’ll run the numbers for you. Be warned that it is difficult to find peak power RPM data for some engines so it may not always be possible.
Also, this formula could be extended to forced-induction engines but it would require knowing the engine’s boost pressure at peak power (this may be different to maximum boost pressure). If anyone knows where you can get data for this, please link!


Comments
My car gets a score of about 29.4
125hp 1.6 that doesnt make peak power until 6200rpm
This is seriously awesome!! :D :O Also can this method be applied to electric cars as well?
I like the idea behind this and agree that HP/per litre alone isn’t a measure of performance! BUT there is a critical error and one which I’m not sure can be corrected easily.
Taking a snapshot of an engines performance at one point skews the results to a single point in time when in reality the total area under the (torque) curve that matters. That’s one reason why both the VQ37 and 8GR appear to perform quite averagely despite having broad torque curves and lots of low down torque.
Using your formula the standard 458 engine would drop a whole 2 points over the speciale to 32.1 - on par with the JDM K20A despite the 458 engine making 10% more torque per litre throughout most of it’s range.
In fact talking of torque(!) if you look at peak torque figures the Ferrari V8’s produce more torque per litre than the V12’s.
The Toyobaru scored very highly in the comparison despite a JDM K20 displacing the same also making 205hp by 7000rpm. The fact the K20 goes on to produce 221 at 8000rpm whereas the GT86 engine drops off in power isn’t reflected by the formula.
Hope you don’t think I’m just trying to piss on your parade as I agree with the fundamental idea! I think perhaps BMEP is the formula you’re seeking…
Hey, my 1.6 MX-5 is JUST better than a prius engine. I always thought they were good for what they are. Let´s see the chart again with forced induction.
I would like to see the CG13DE from the K11 micra super s. I4, 1275cc, 75 hp at 6000rpm and 75 lb.ft at 4000rpm, 9.5 compression ratio, DOHC 16valve engine.
Damm never really thought about it this way, but it totally makes sense lol.
You missclicked for the SLS AMG, it’ 6.2L in diaplacement. Great article, very pleasent to read ;)
Love this comparison. Much more level playing field than other methods. I’m curious as to how displacement effects power and how high reviving effects power relatively, could they not have linear relationships?
Vehicles that I would like to see compared:
Unfortunetly the whole basis of the forumla relies on peak HP rather than area under the curve reduces the usefulness of this table completely.
Pagination